
Problem Space
The Production Matrix is an internal tool that benchmarks teams on service reliability and operations using standardized metrics. It tracks maturity levels, highlights improvement areas, and supports reliability and operational excellence initiatives.
The Reliability Program Maturity Model (RPMM) is a framework for assessing and improving system and service reliability. It evaluates practices across dimensions and maturity levels to guide improvements and set reliability goals.
"I love reliability and I’m frustrated by doing it. It’s not as recognized, it’s difficult, it requires a lot of work, and the tooling is really bad." - UX Research feedback
Problem area and Initial kickoff - UX Research feedback insights:
A major space within Meta's Infra was the goal of reducing major SEV events by securing the reliability of services in terms of measured performance goals. The concept of reliability should facilitate, not hinder innovation, by demonstrating the impact of high-performing services in terms of "the SEV that never was".
Initial interviews provided valuable insights, although The above direct quote summarized it well, noting that reliability is essential but under-appreciated, challenging, and hampered by poor tooling. We found that reliability becomes increasingly critical as we scale and face complex risks. However, it must balance enabling innovation with avoiding inflexibility. Currently, progress relies on champions driving reliability efforts, but there’s still work to do in defining its impact, rewarding contributions, and providing better tools for teams.
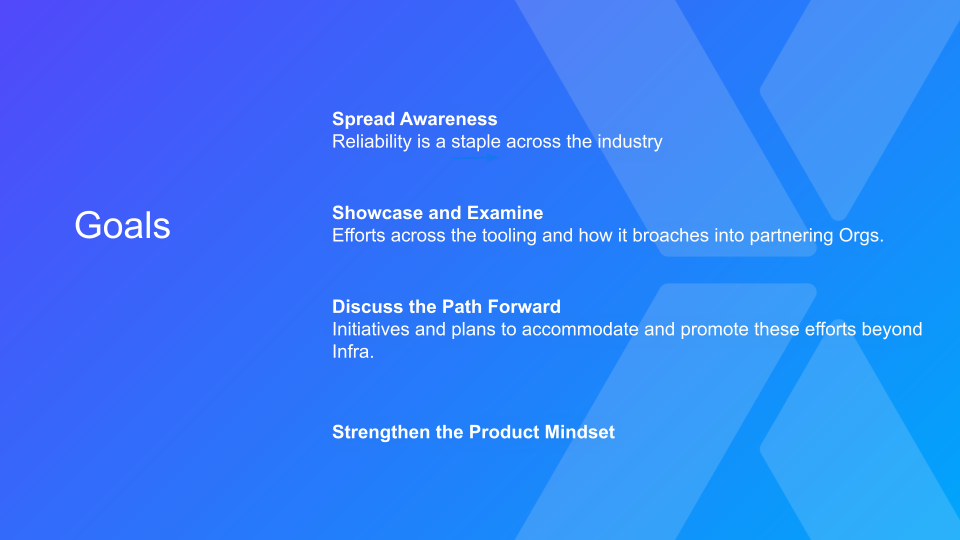
Goal / Hypothesis:
Improving tools and offering guidance will help teams build and track reliability programs, thereby reducing the risk of failures landing in production. Prevent bad code and configuration changes from hitting production (and reduce the impact of those that do) through high coverage and high quality safety mechanisms.
Current State of Things:
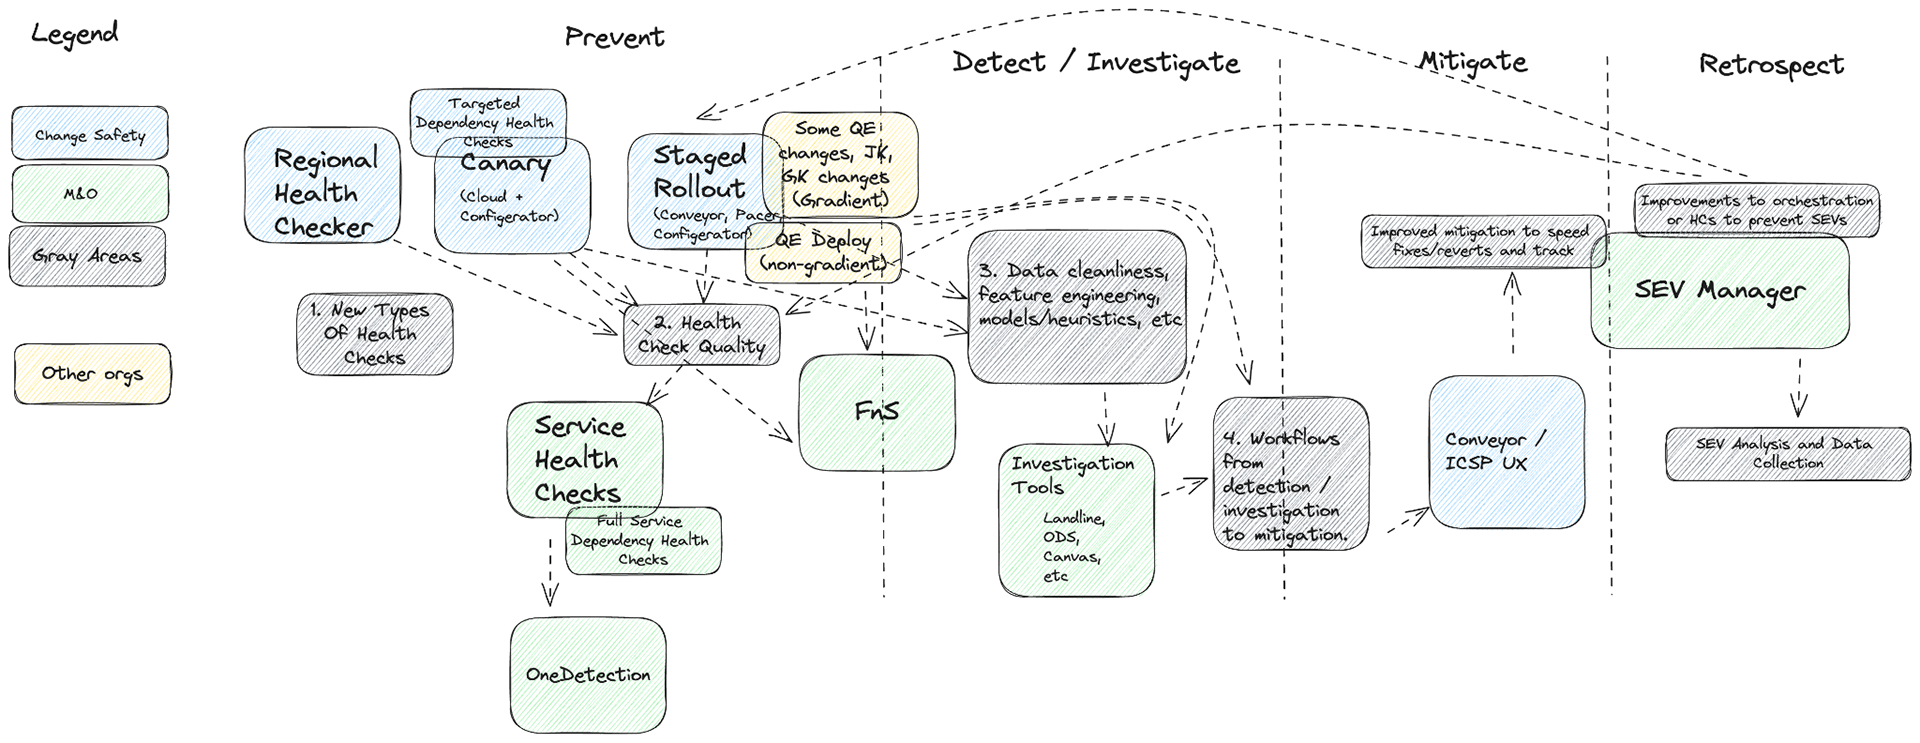
Here’s a high-level view of the change safety ecosystem. The tools are diverse, spanning multiple areas, each handling specific tasks.
This diagram highlights two key points:
1. The shared goal of preventing bad changes and quickly detecting and fixing them.
2. The complexity of tools spread across multiple teams (prevention, detection/investigation, retro).
The push for improvement was driven by a major incident earlier this year when a skipped health check caused an outage, along with similar issues in the past. To address this, we focused on enhancing deployment practices and refining the tools in this ecosystem.
These tools are essential for ensuring reliability, prevent revenue loss, protect Meta’s reputation, and avoid significant risks.
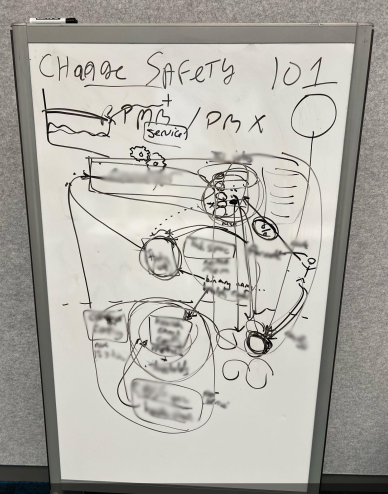
The "spaghetti bowl"
We mapped out the fragmented experience and identified key areas for improvement. The tools, scattered and disconnected, needed upgrades to reduce SEVs caused by Changes.
We focused on three main products, with Production Matrix as the potential entry-way.
Production Matrix needed to interpret and illustrate enhanced visibility and accountability for reliability maturity, including Change Safety.
By simplifying and connecting this tool better into the ecosystem, we aimed to reduce complexity and lower the risk of production errors from potentially risky changes.
Approach:
1. Identify features and categorize in terms of legacy status.
2. Identify opportunities to consolidate for reducing toil and automate processes.
When refreshing a known product, there is never a need to wipe it out entirely because you're ignoring a legacy purpose.
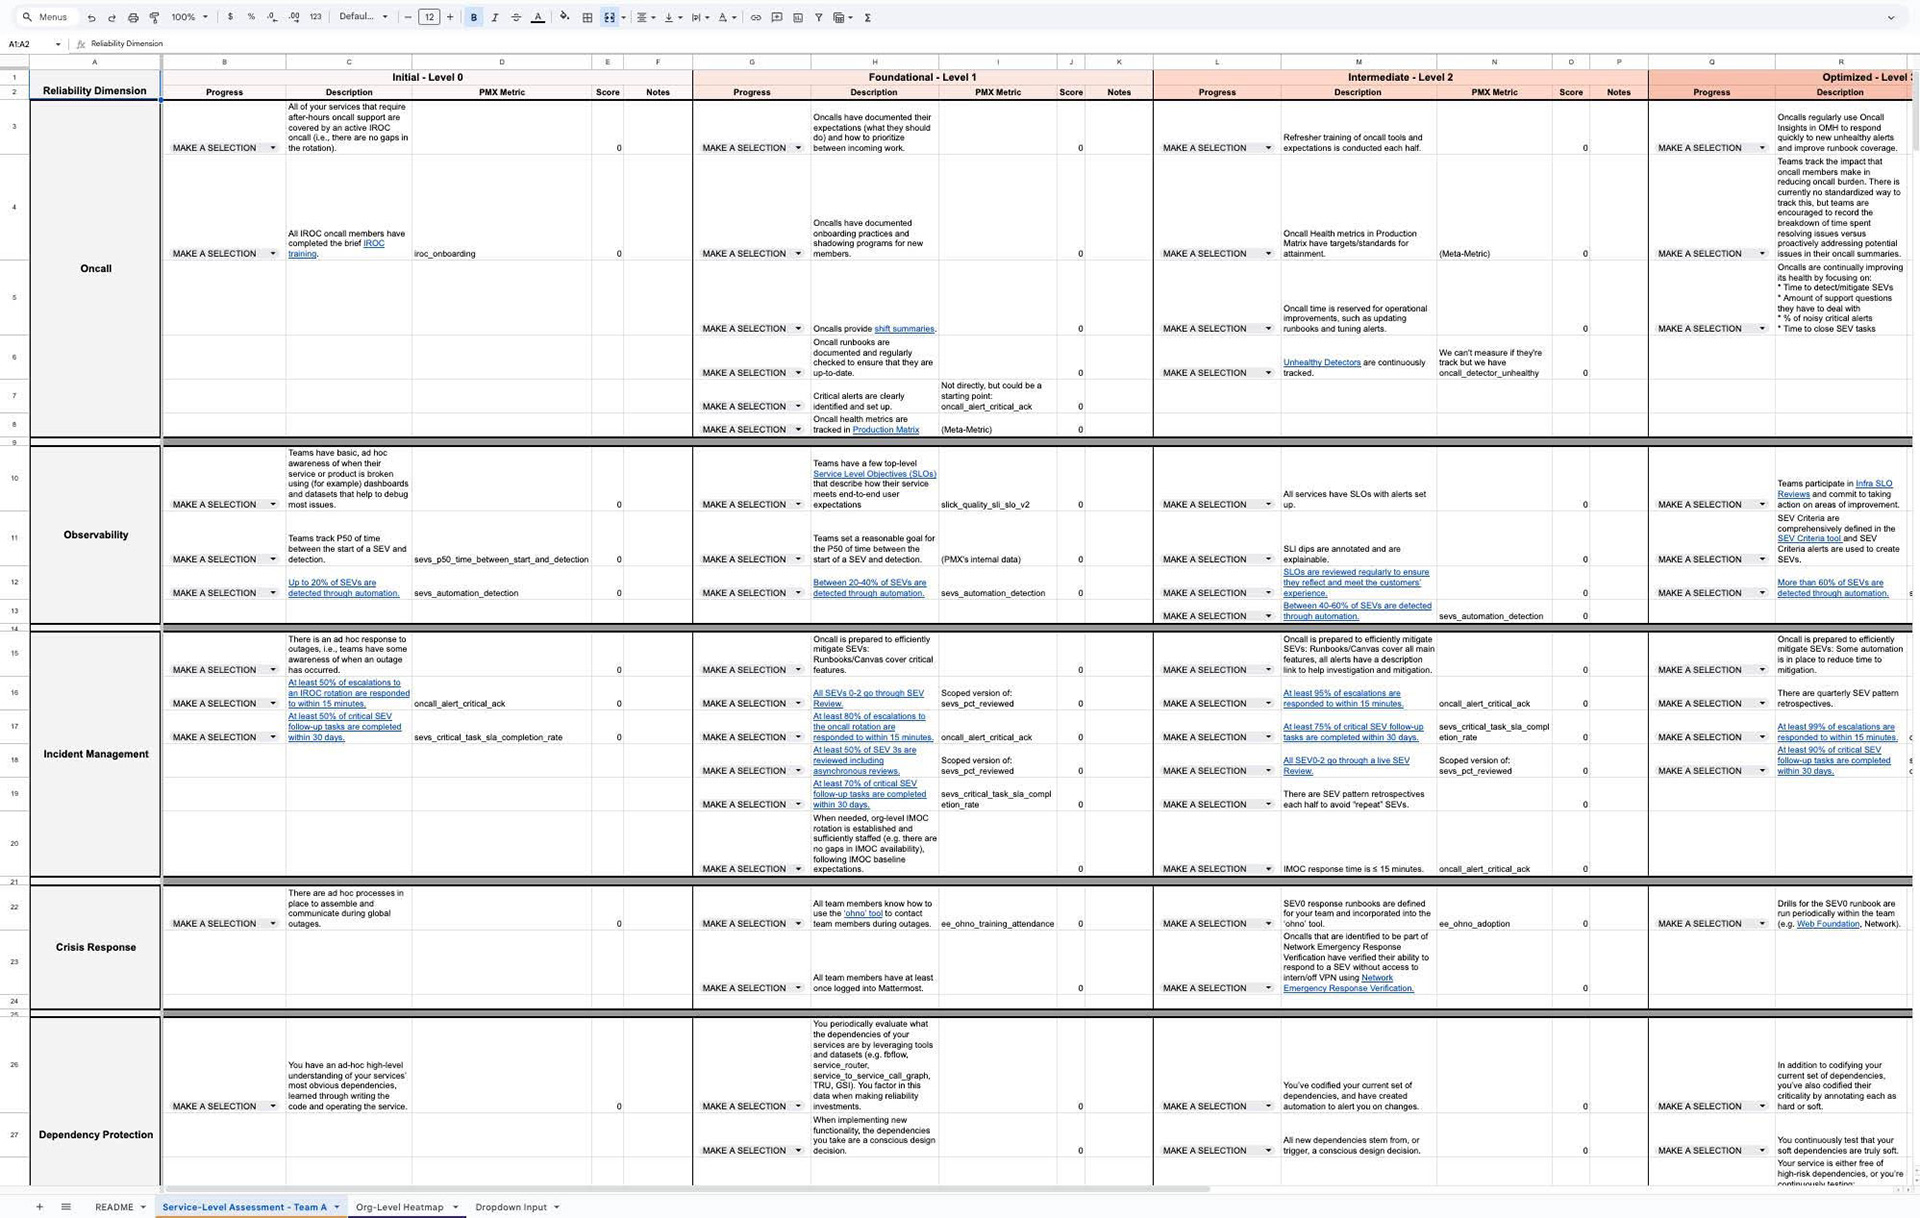
Feature: Automating the self-assessment tool
(Converting a manual process from a google sheet into the UI)
(Converting a manual process from a google sheet into the UI)
Process:
We streamlined the Reliability Review process, replacing its complex, expert-focused Google Sheet workflow with a simpler and more user-friendly experience automatically built into the UI.
We streamlined the Reliability Review process, replacing its complex, expert-focused Google Sheet workflow with a simpler and more user-friendly experience automatically built into the UI.
Impact:
We elevated key metrics in Production Matrix, automated performance tracking, and tailored the experience with service data. This positioned Production Matrix as a central tool for improving reliability and guiding users toward actionable steps to boost their scores.
We elevated key metrics in Production Matrix, automated performance tracking, and tailored the experience with service data. This positioned Production Matrix as a central tool for improving reliability and guiding users toward actionable steps to boost their scores.
Before (as a spreadsheet):
After: as an embedded reporting dashboard
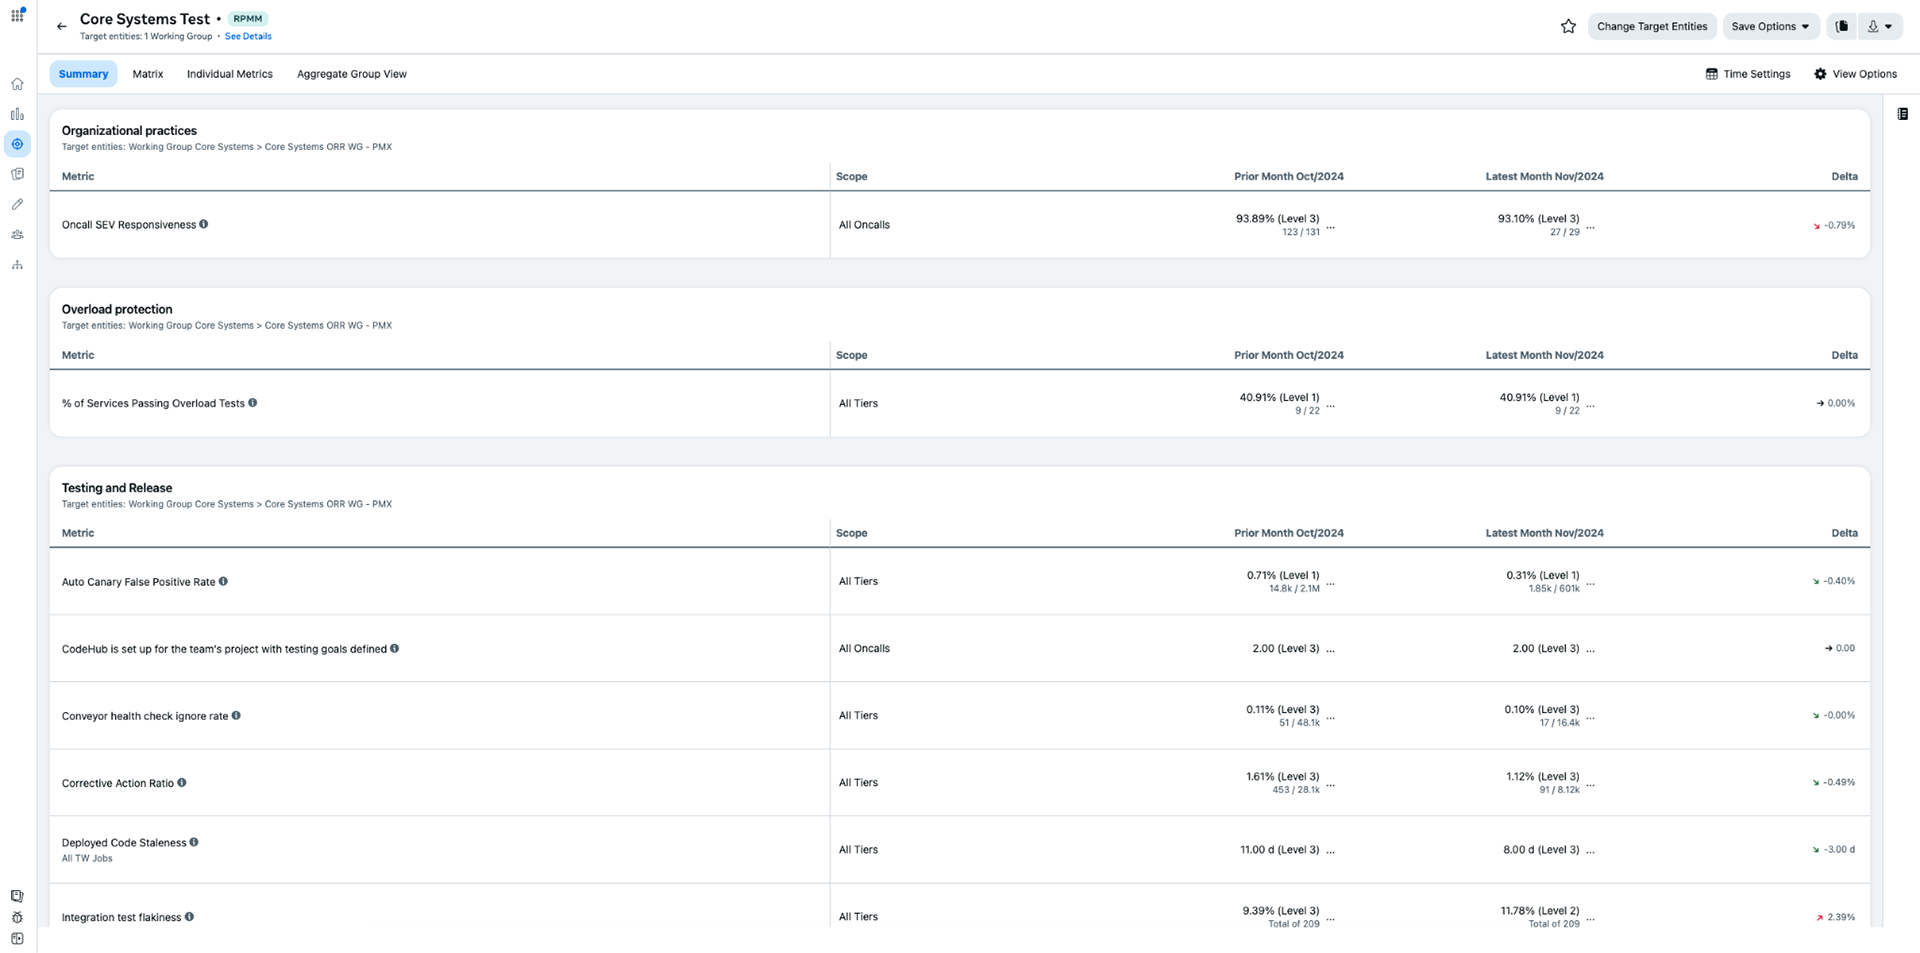
With an additional redesign of the Production Matrix home page to funnel users into running their own "Program", which would serve as a "snapshot" in time of their Organizations' performance (below).
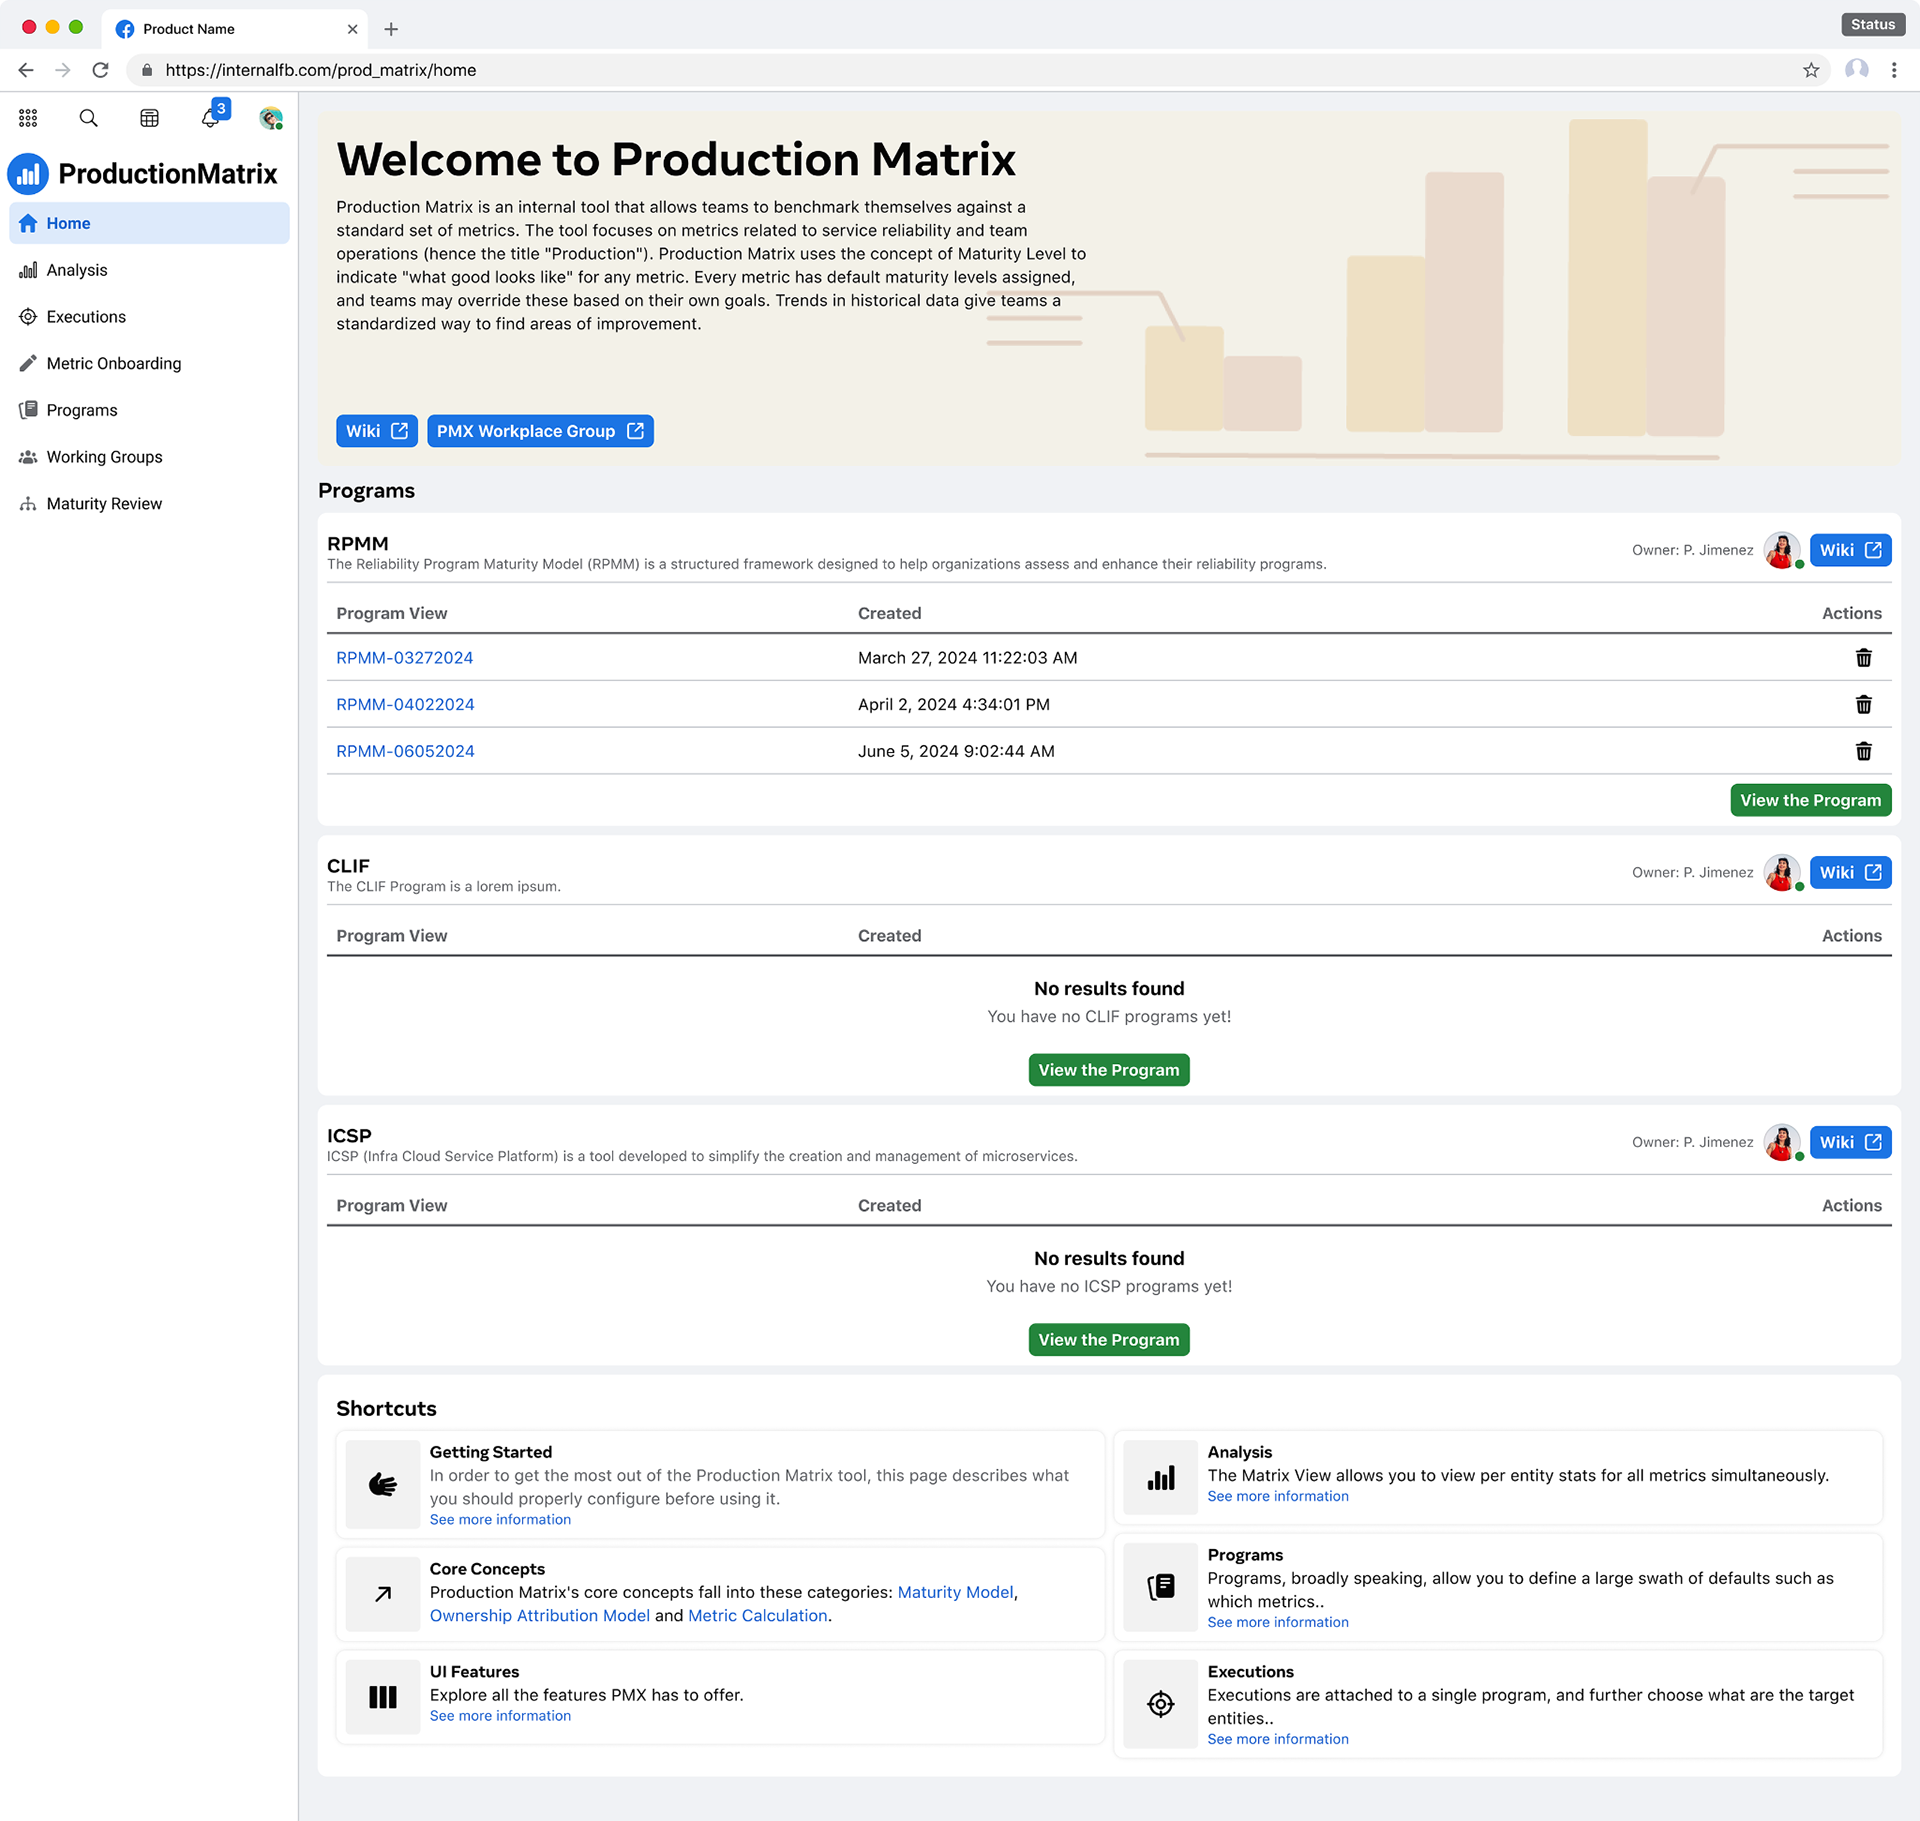
With Production Matrix now serving as a key entry point, the focus shifted to enhancing other tools—simplifying processes and paving the way for further improvements to reduce risks from changes.
Service Console
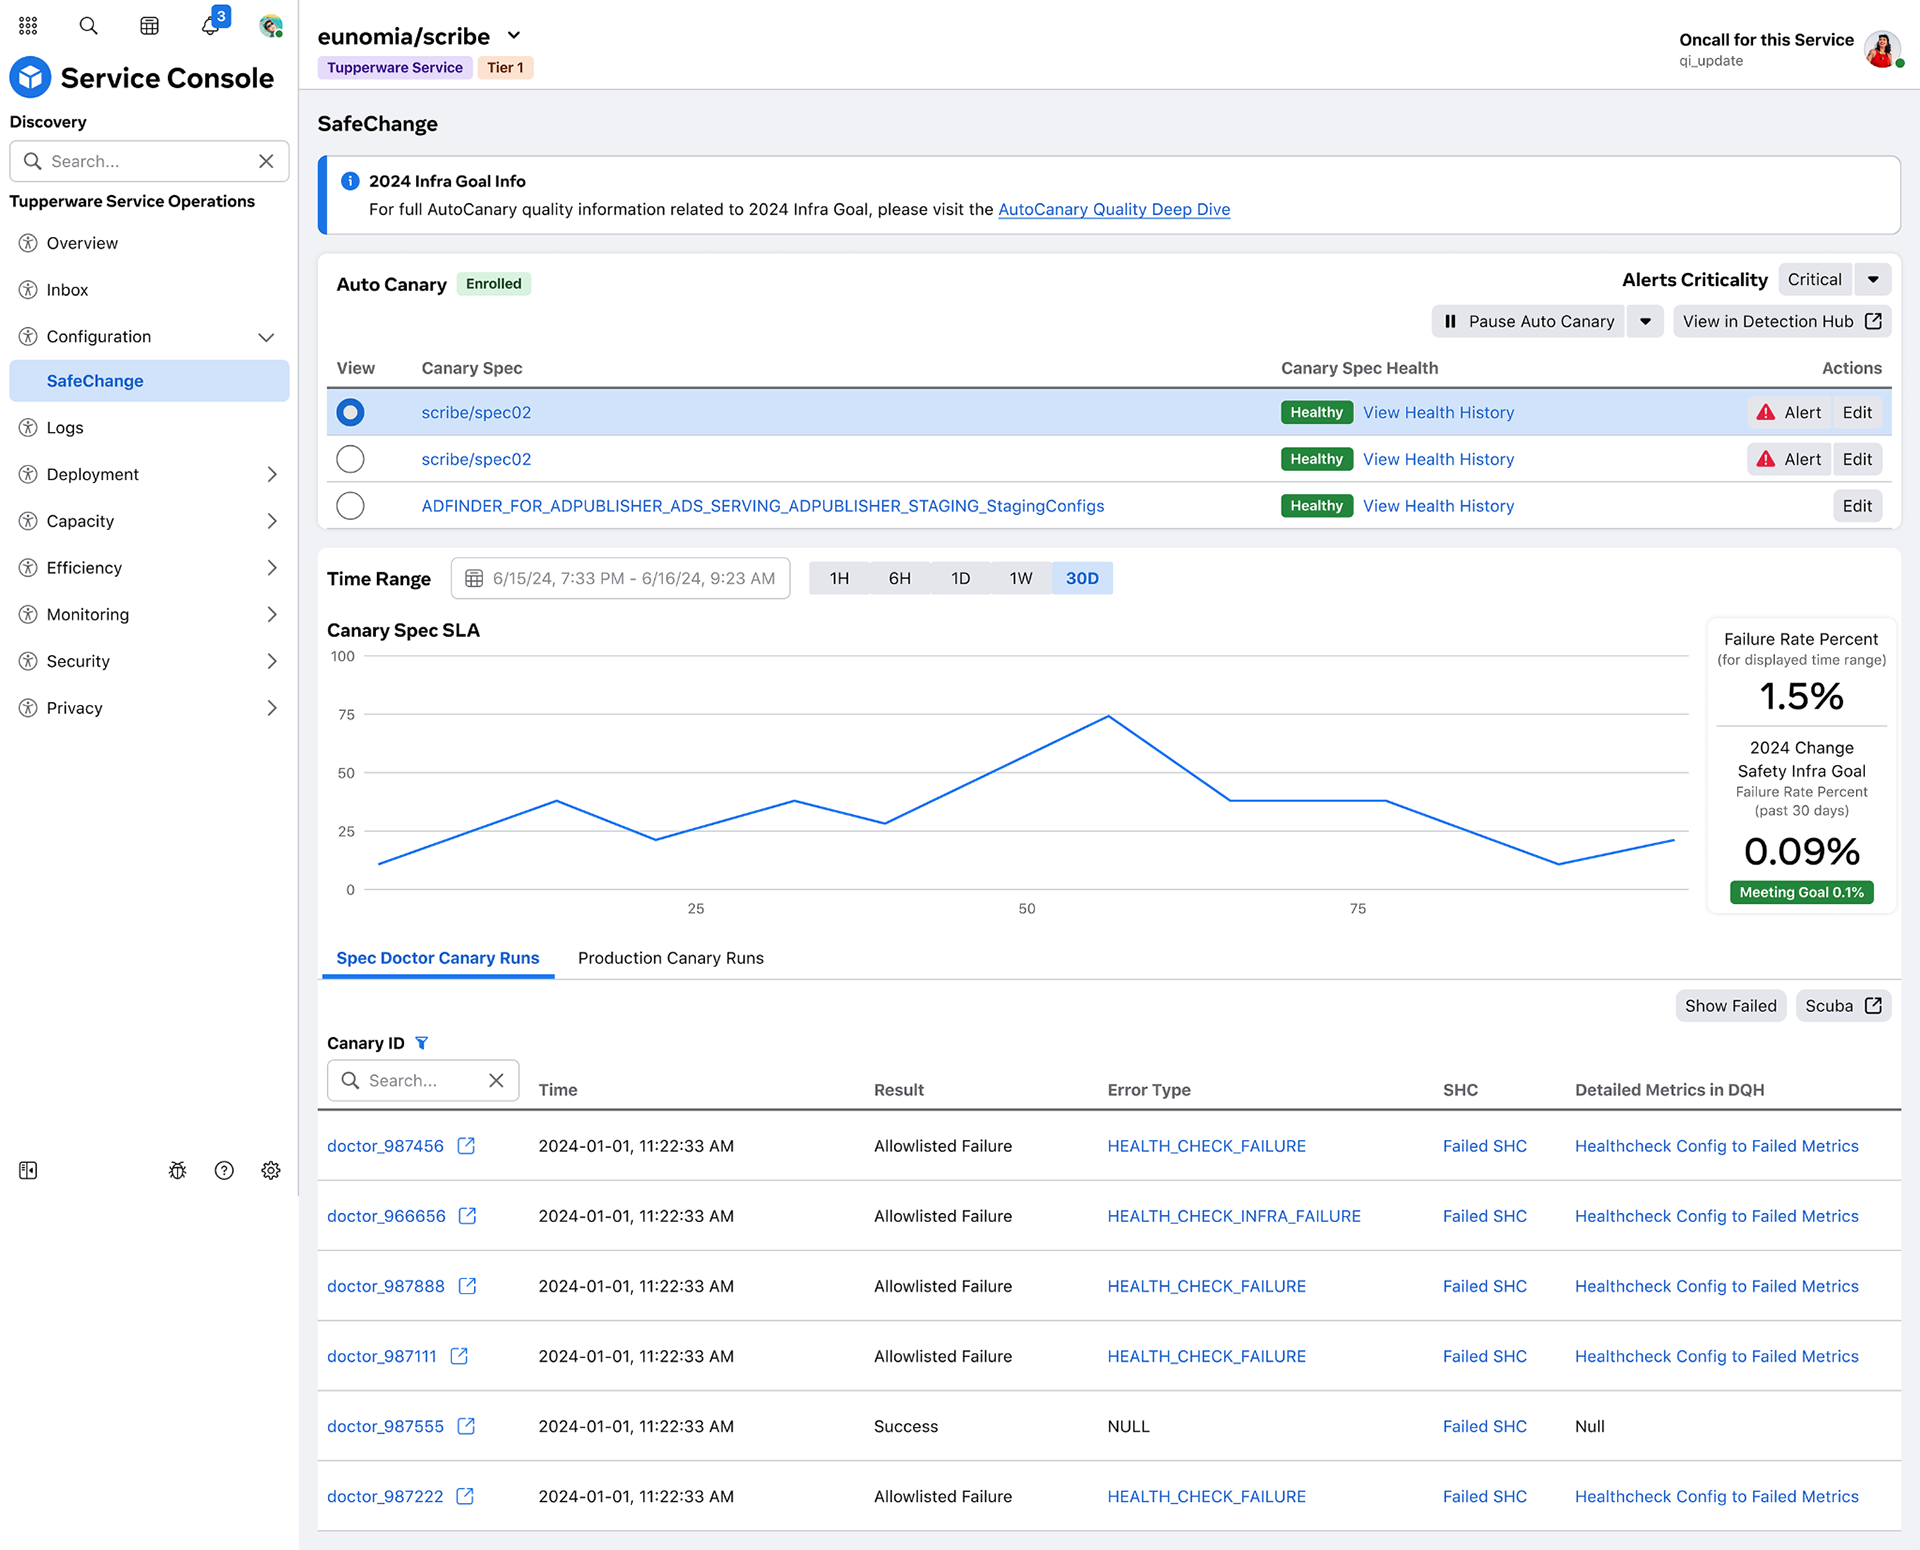
Service Console had an issue where some tests appeared successful even when they weren’t, causing confusion.
We focused on making test performance clearer and easier to understand, so problem areas could be spotted and fixed.
This helped ensure only the right changes went through, improving the overall quality and reliability of our systems.
We focused on making test performance clearer and easier to understand, so problem areas could be spotted and fixed.
This helped ensure only the right changes went through, improving the overall quality and reliability of our systems.
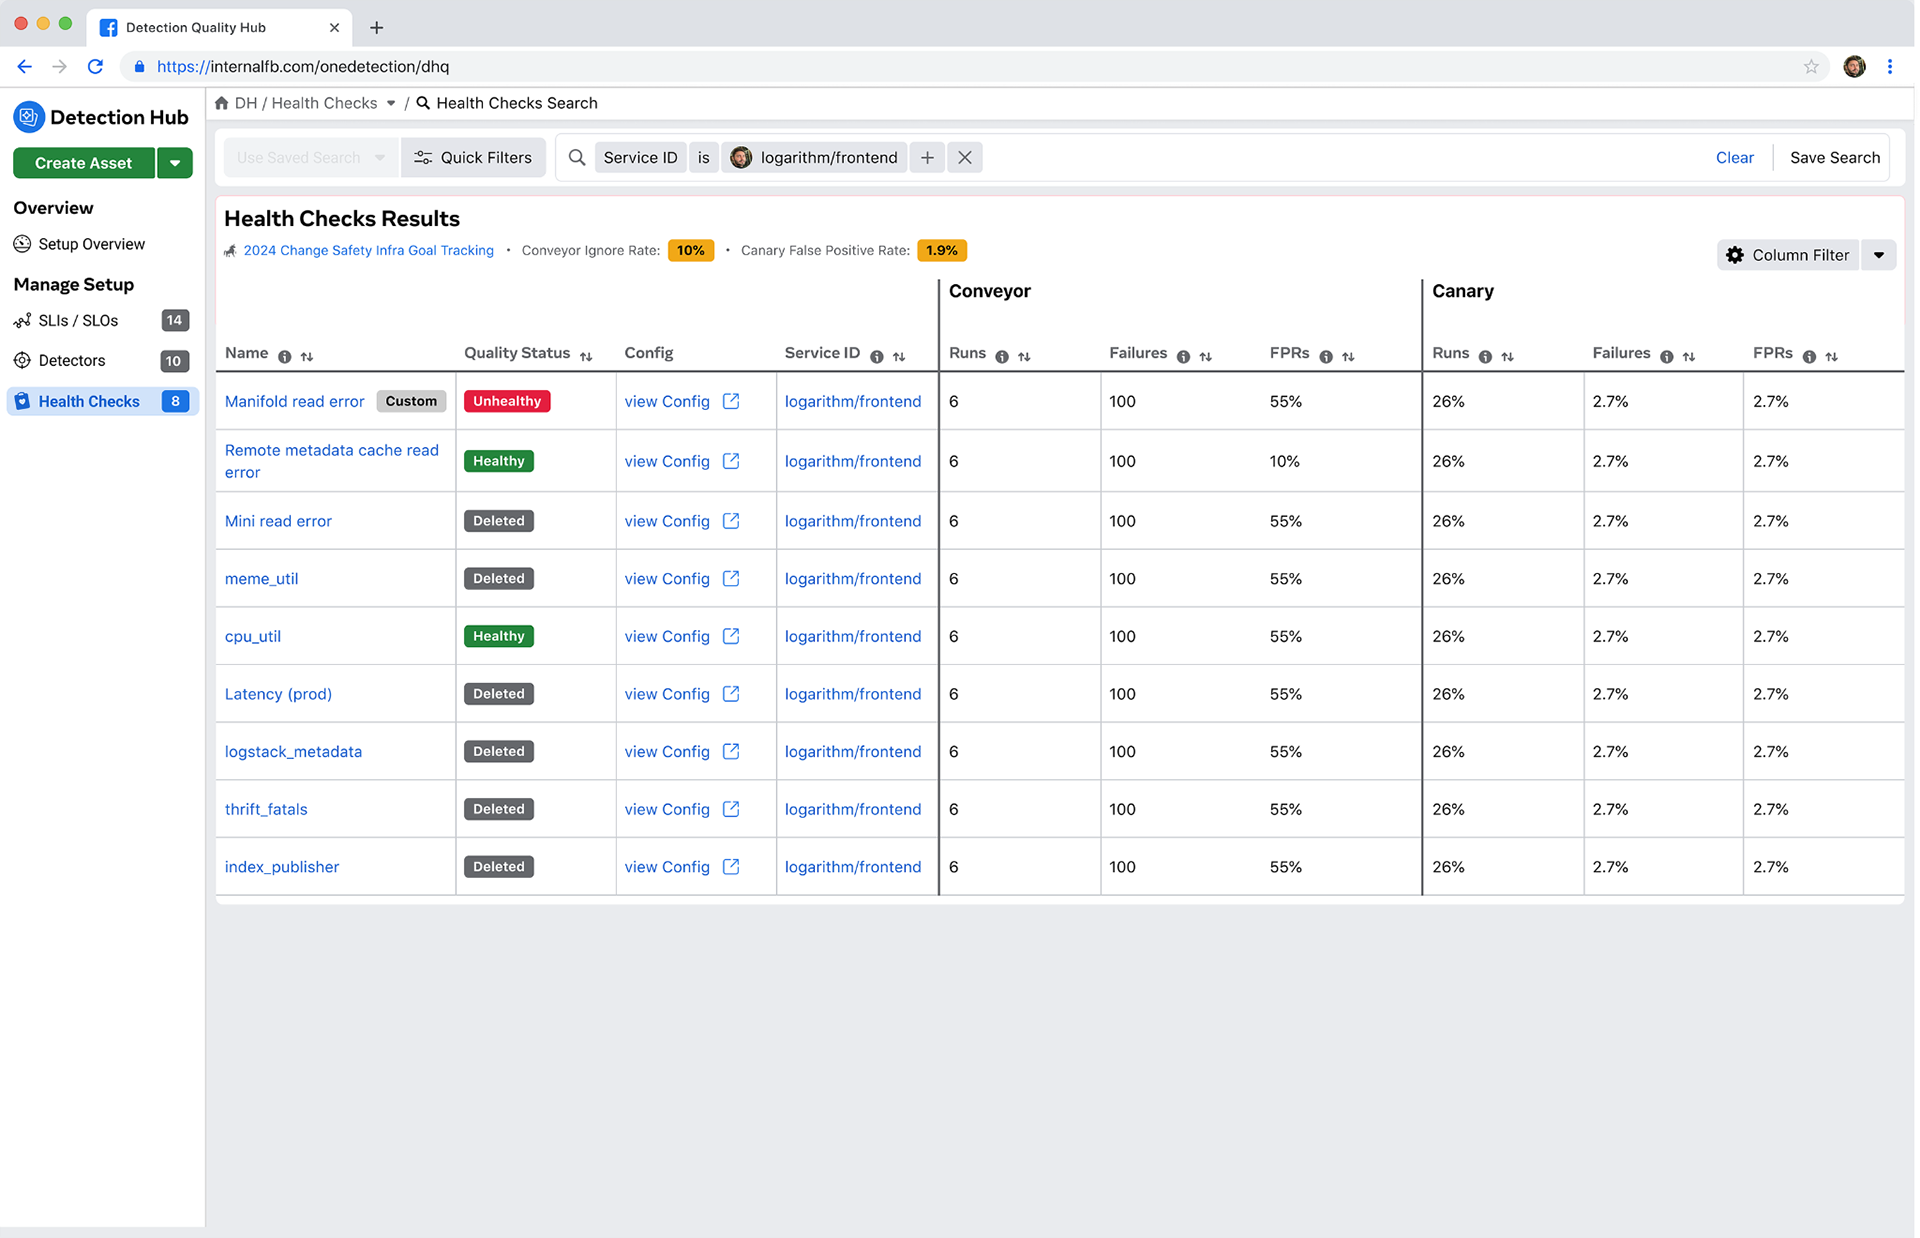
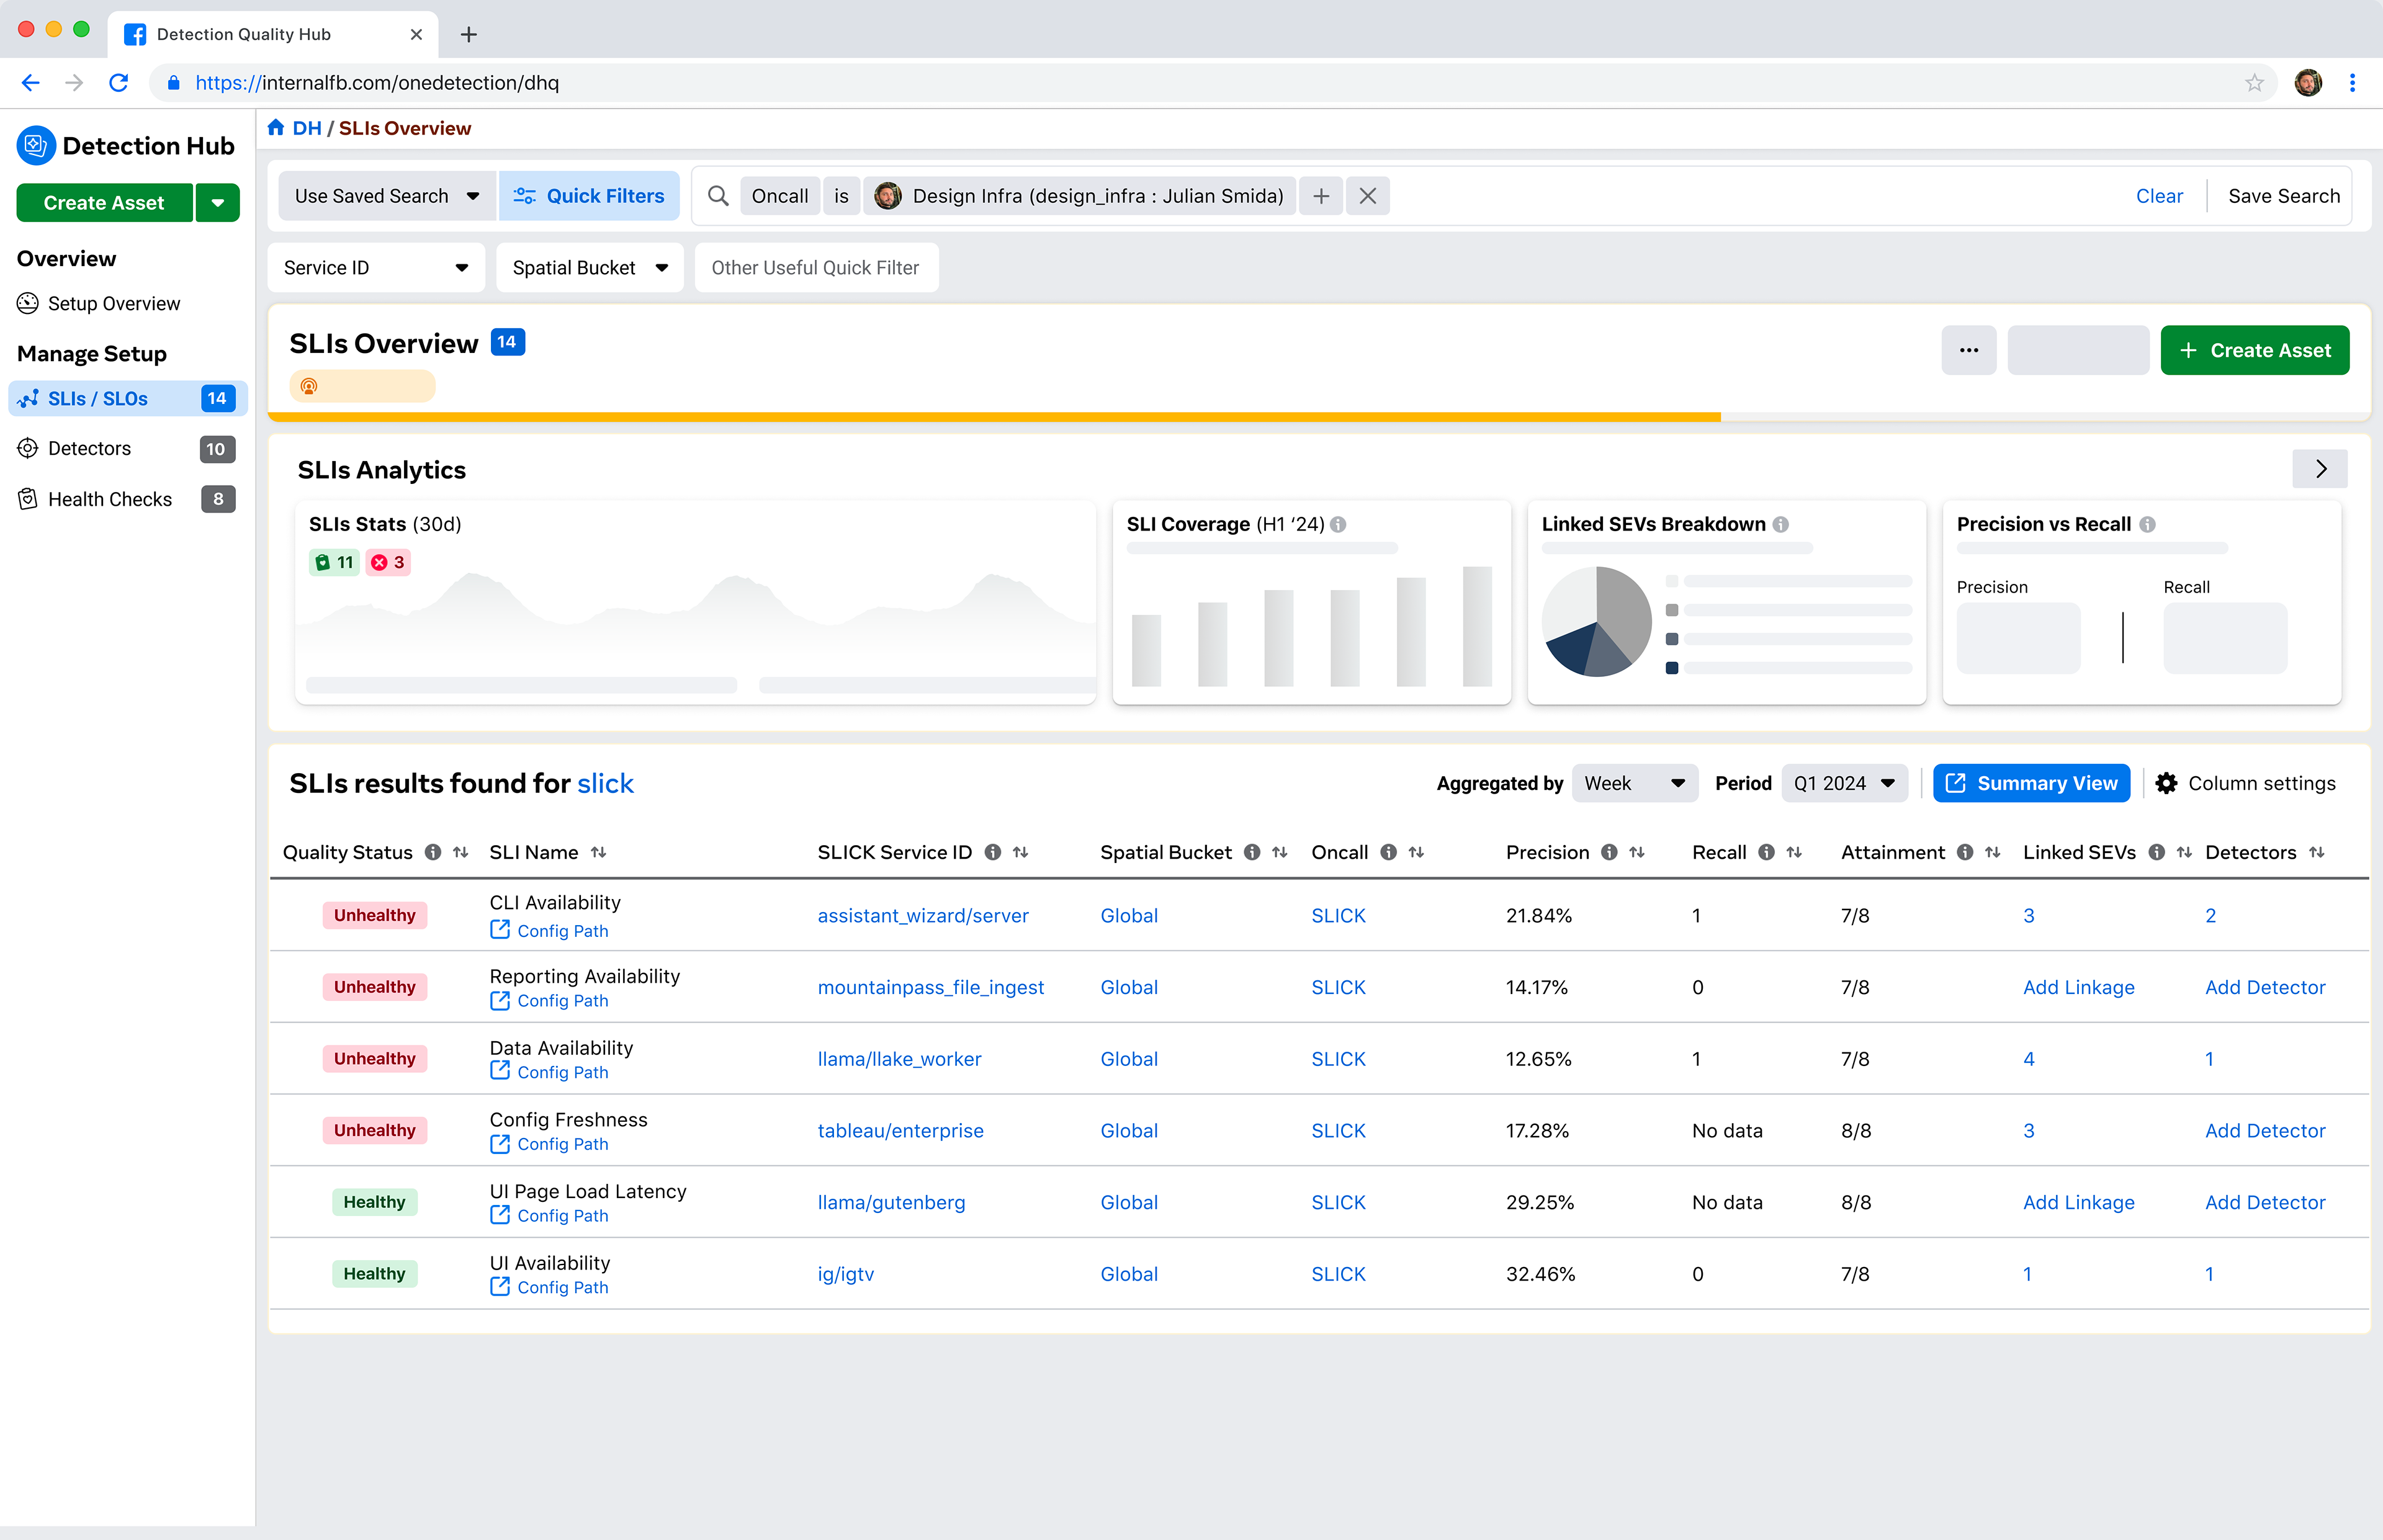
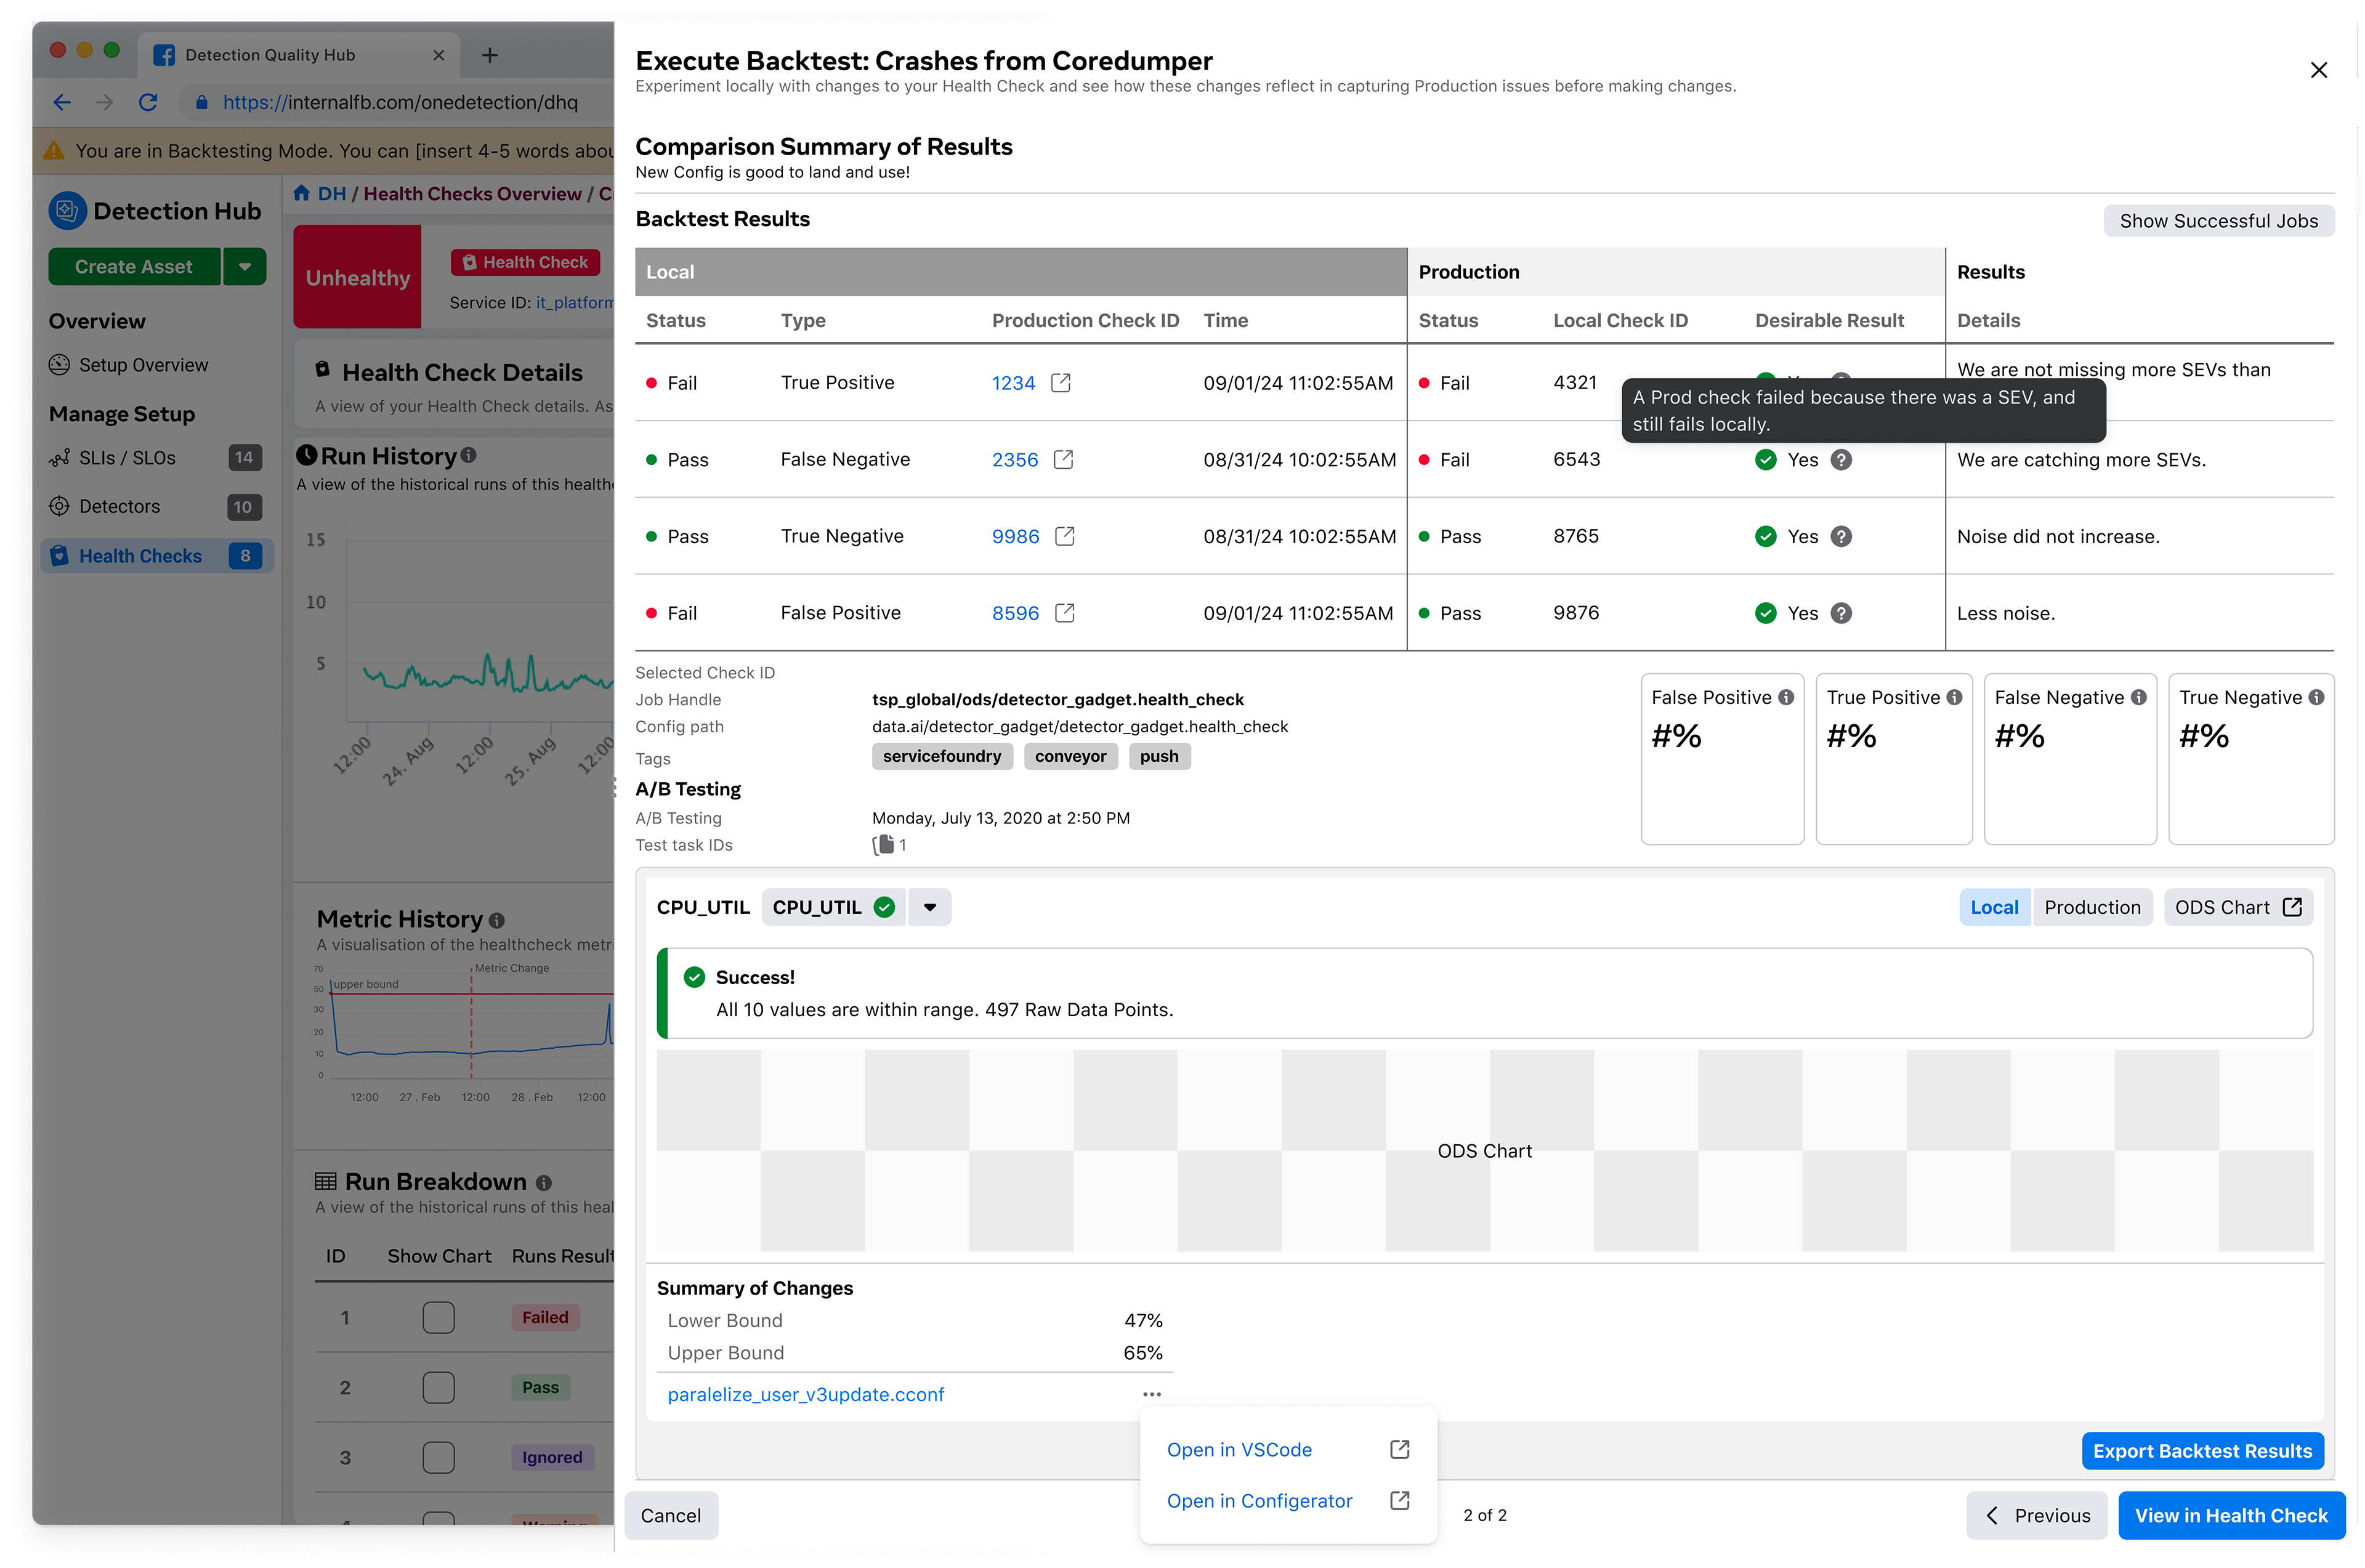
Detection Hub
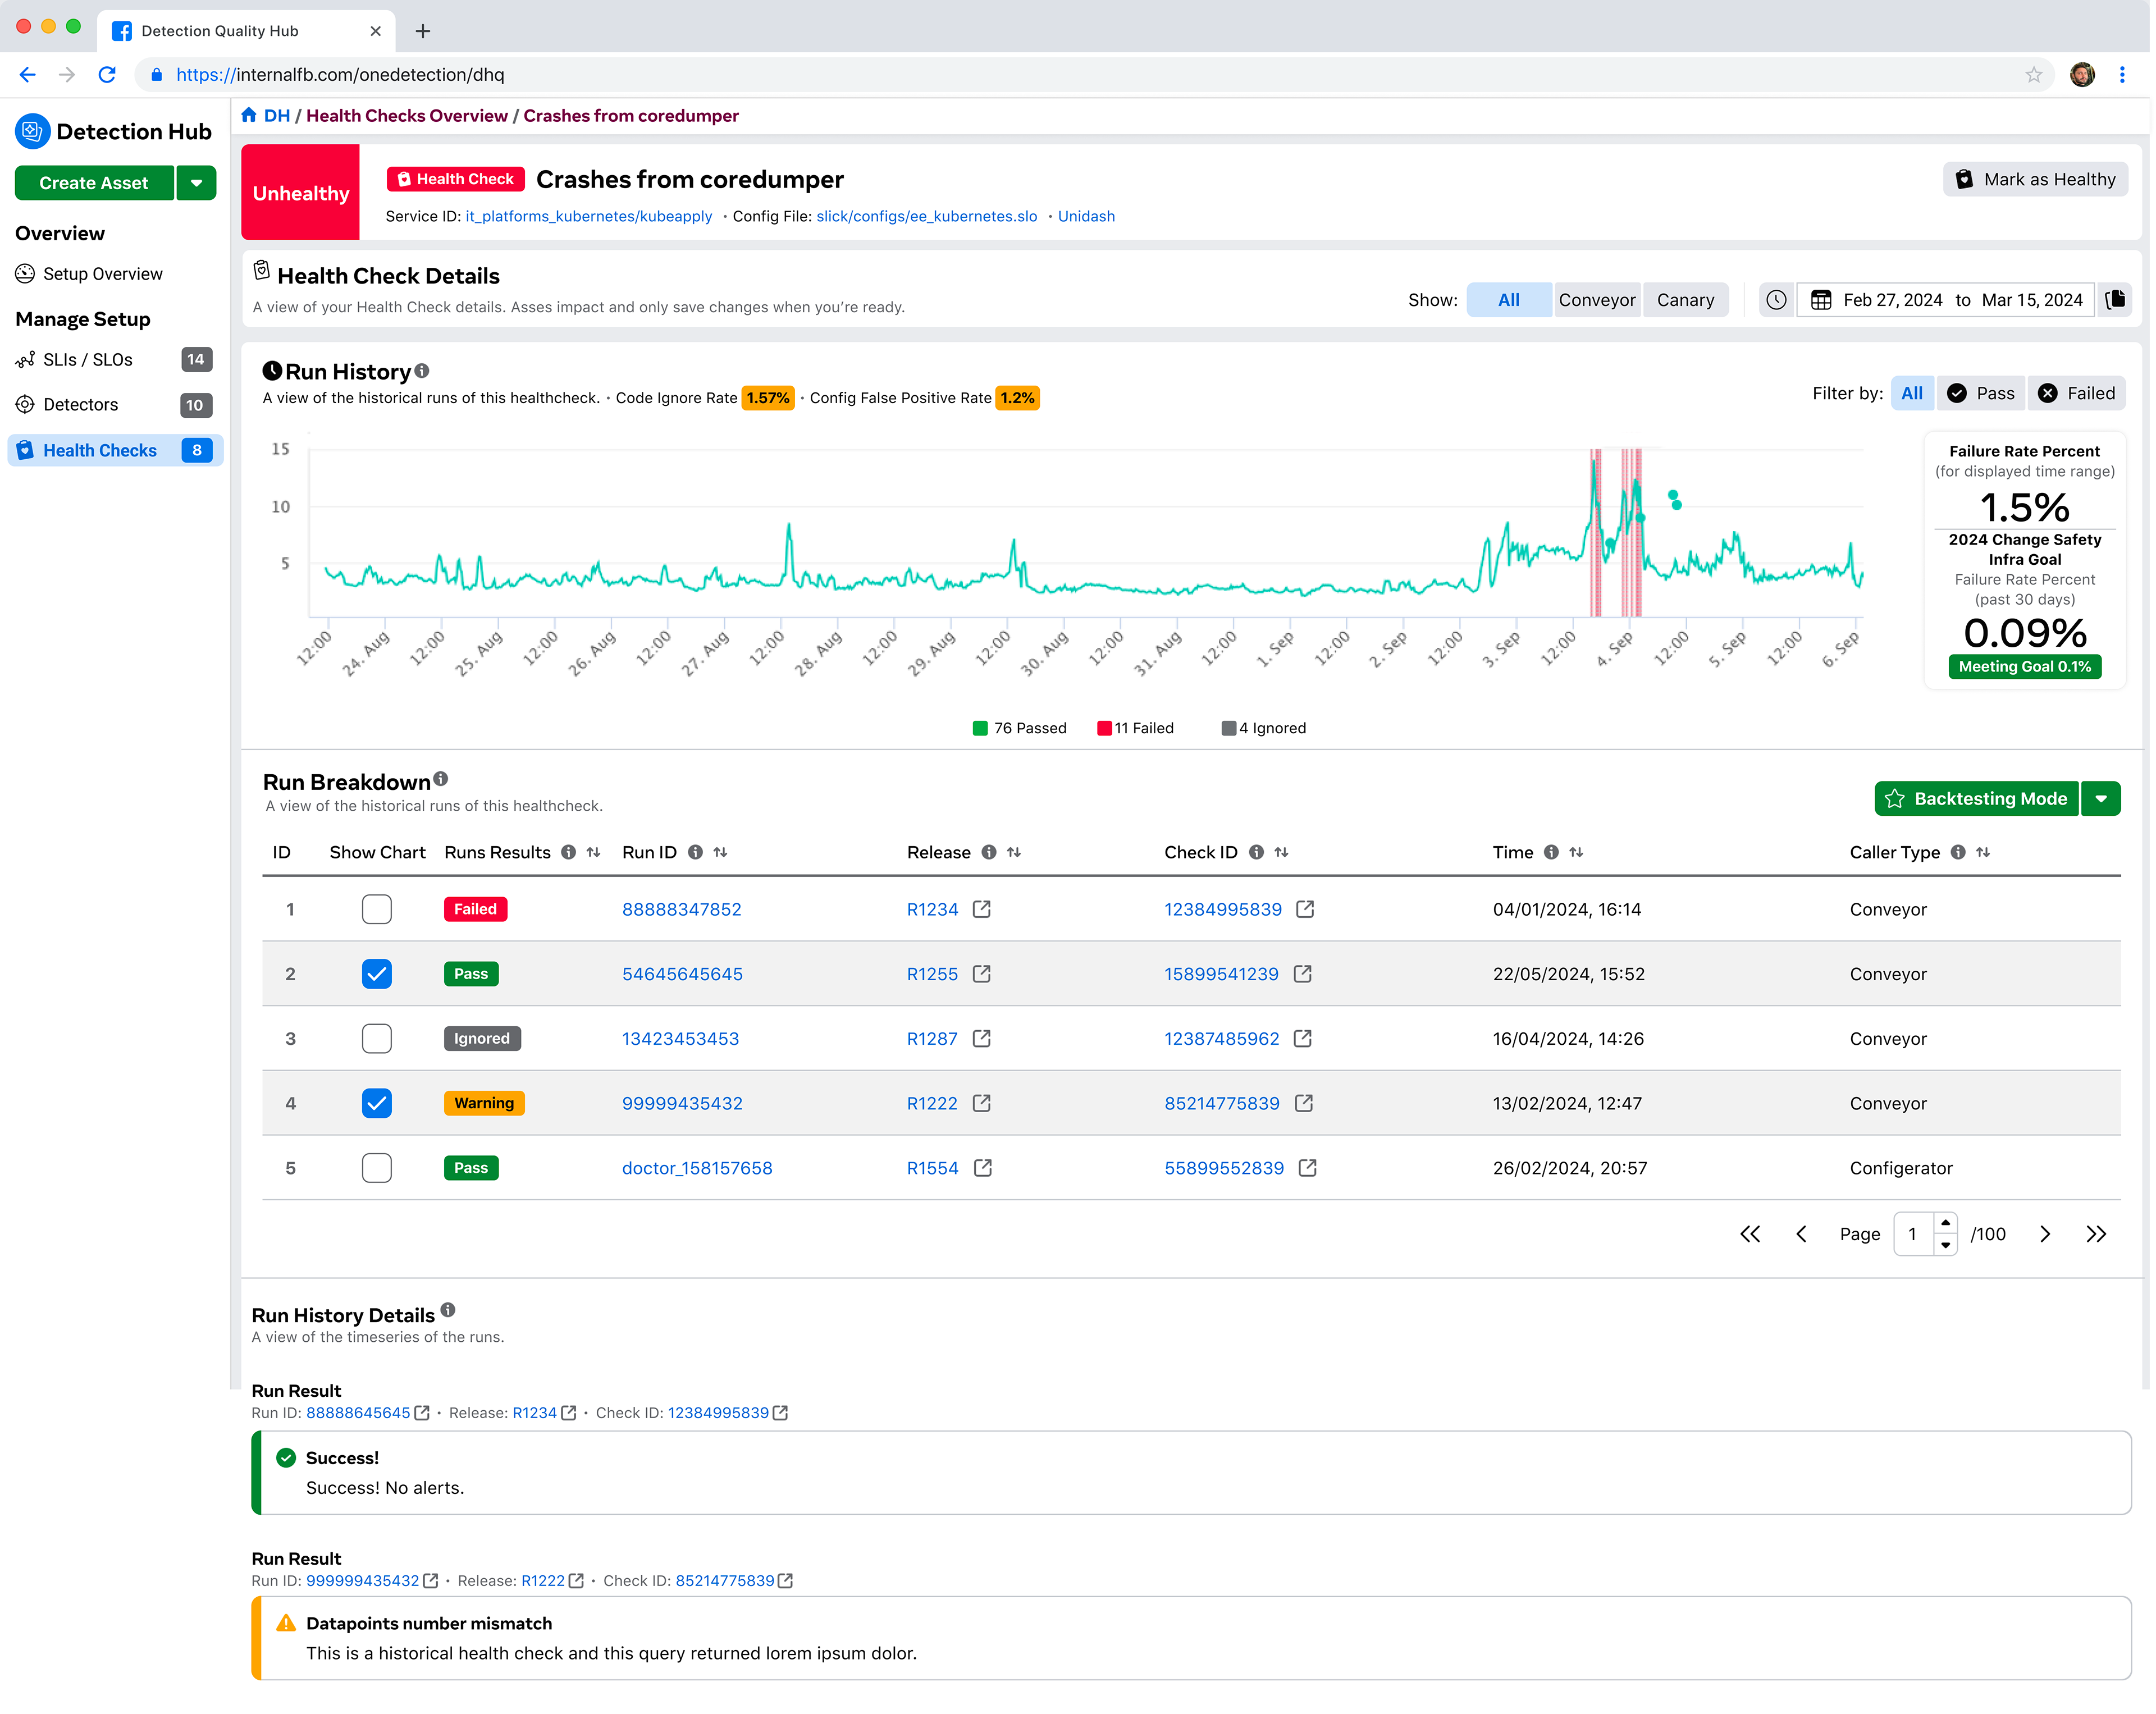
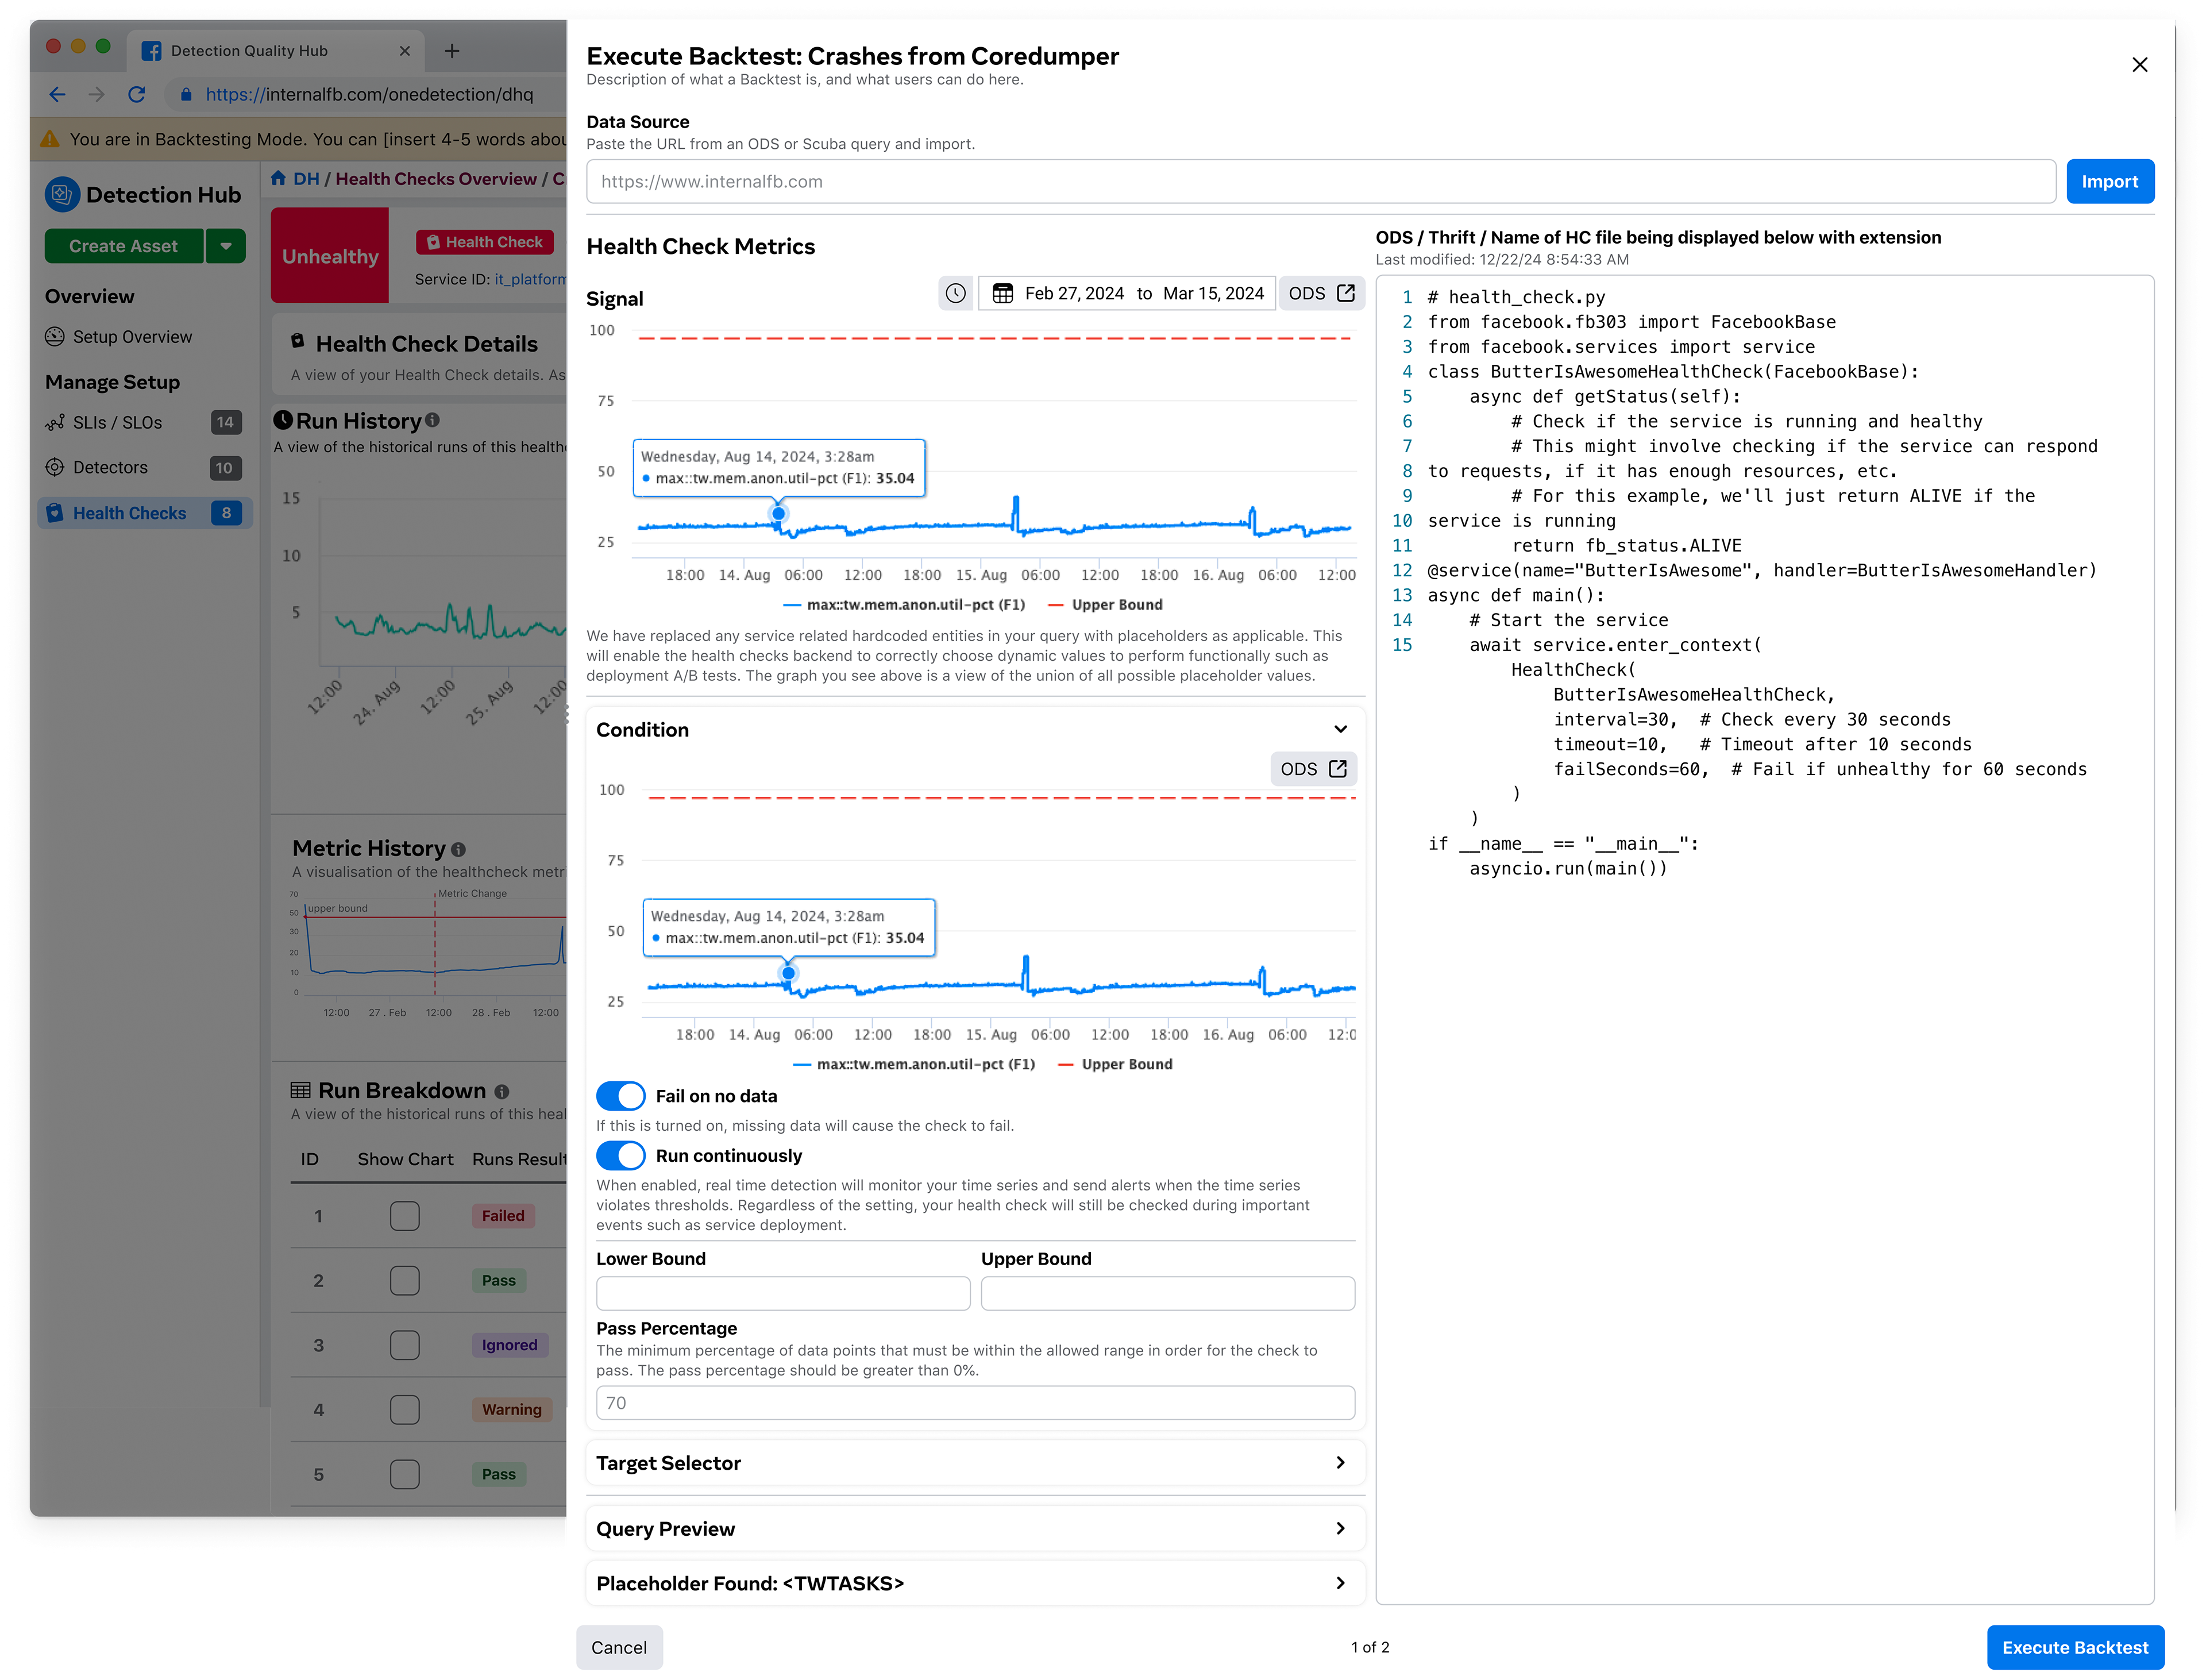
We improved Detection Hub by simplifying access to data and making Health Check updates easier. A clearer interface and the new backtesting feature helped users confidently refine checks, leading to more reliable results.
Stakeholder Workshop to Drive Direction and Strategy
This was preemptively supplemented by a workshop to align the team on priorities, enhance the Health Check interface to expose more specific quality data on failures, and introduce a feature called a “Backtesting” which allowed users to confidently test changes on historical data, ensuring more predictable results.
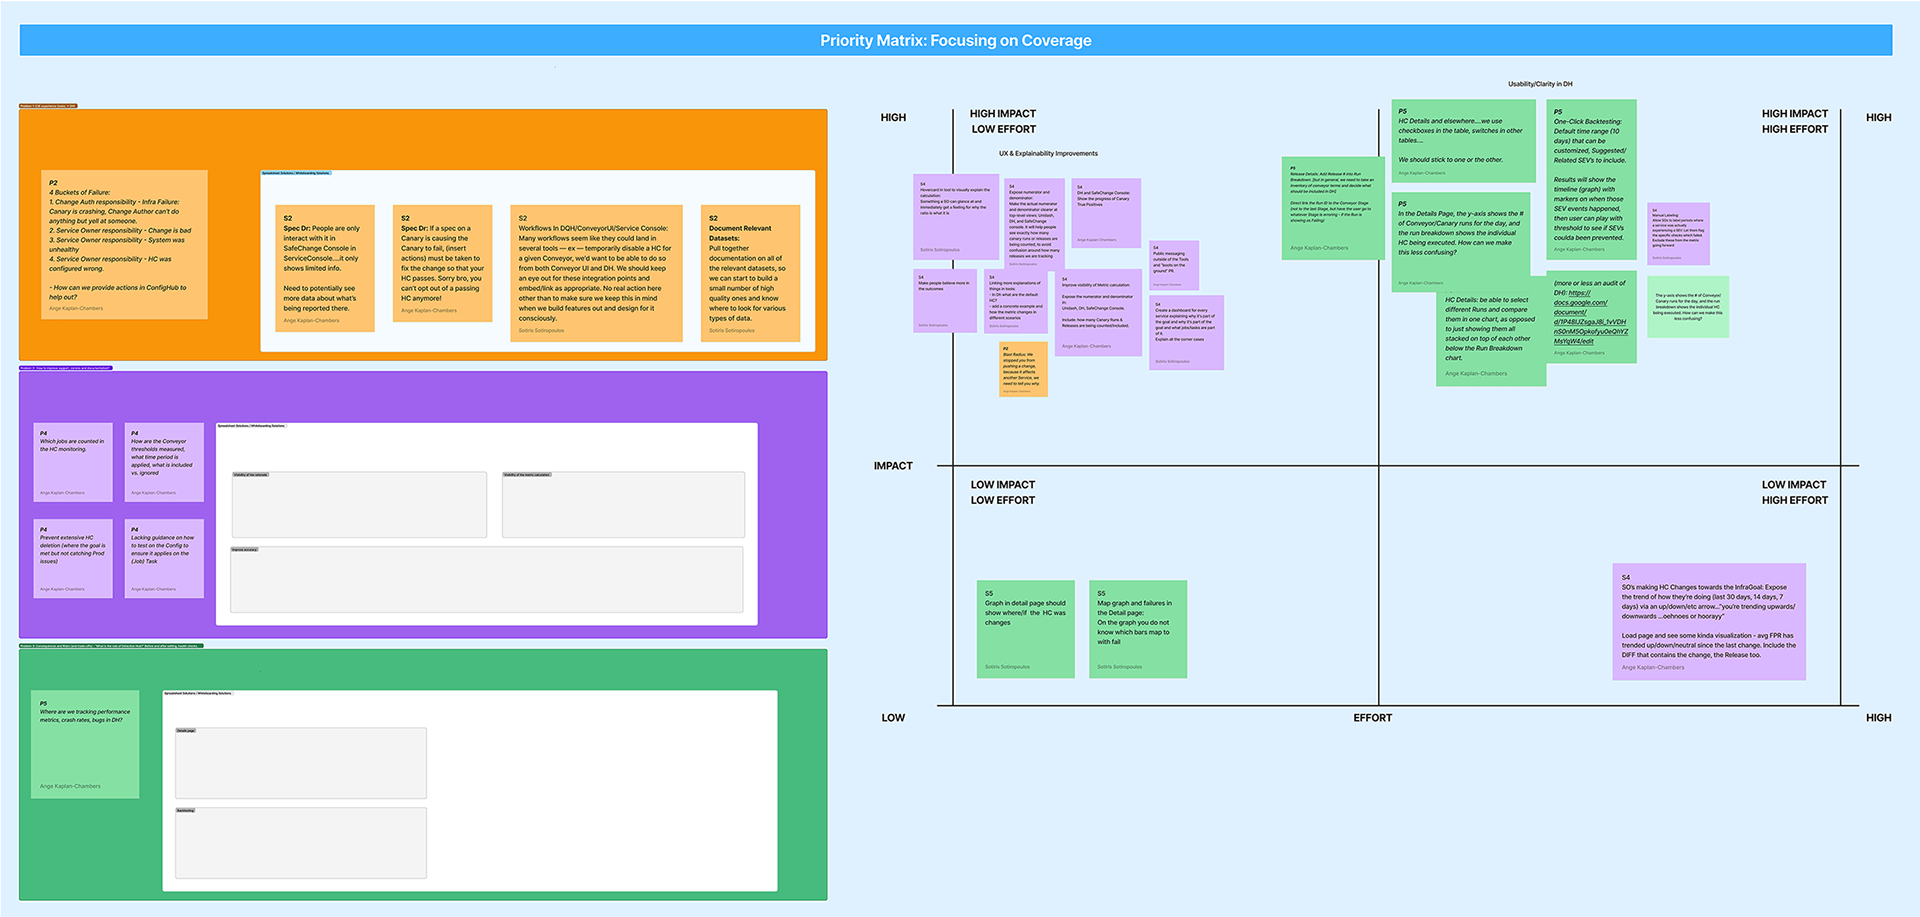
Results (partial) of a 4-day workshop across multiple teams supporting Detection Hub to prioritize efforts and lay out the roadmap for the next 6 months.
Metrics for Success
*Designs clarified the Program's onboarding process and established Production matrix as the single point of entry for reliability across all teams.
* Enabled the Business Outcome Review for the next half to align business need with product roadmap goals.
* Usability upgrades empowered program owners to track their high-performing services.
* Designs clarified progress towards individual team safety goals.
* Empowered leaders to set and maintain reliability goals with minimal regressions towards risk.
* Enriched support messaging, funneling users into actionable workflows instead of dead-ending them into wiki's.
* Enabled teams to evaluate operation levels by designing assessment performance metrics into the UI.
Cross-Organization Opportunities, Connections and Next Steps
To reiterate, this space is complex, these tools are really detailed – they are critical for Meta's performance reputation and bottom-line.